A few tips for modelling and analysing ecological data.
Episode I
1. Remember that all
statistical analyses, from an ANOVA to a complex
Generalised Linear Mixed Model, are just models of how your study system works.
That means that it is up to you to decide an appropriate representation of your
system, and, therefore, it is up to you
to choose an adequate statistical model for your research question and system.
 |
| Ecological systems can be quite complex. Using a model to conceptualise these complex systems help us in understanding their functioning and dynamics. Rainforest in Christmas Island. |
2. Think in terms of
probability distributions. Ask yourself,
what probability distribution does my response (dependent) variable follow?
For example, the measures of the height
of the people in a room would likely follow a
Normal distribution whereas the counts of
the number of people per room in a
building will be better described by a Poisson distribution. Knowing the distribution of the
data will put you in the right direction when choosing the most likely model structure. In the cases where the
distribution of the data is not evident, drawing a histogram could be helpful.
Familiarise yourself with the most commonly probability distributions found in ecology
and the type of data that can be modelled by those probability distributions. Ben Bolker has published an excellent summary of probability distributions and its use in ecology. Here is another great resource for learning about probability distributions and their application in ecology.
3. Run an exploratory analysis of your data. Calculate summary statistics for all your variables, plot histograms (for visualising the distribution of the data), produce scatterplots for examining the relationships among variables, etc. Alain Zuur and collaborators have produced a great protocol for data exploration.
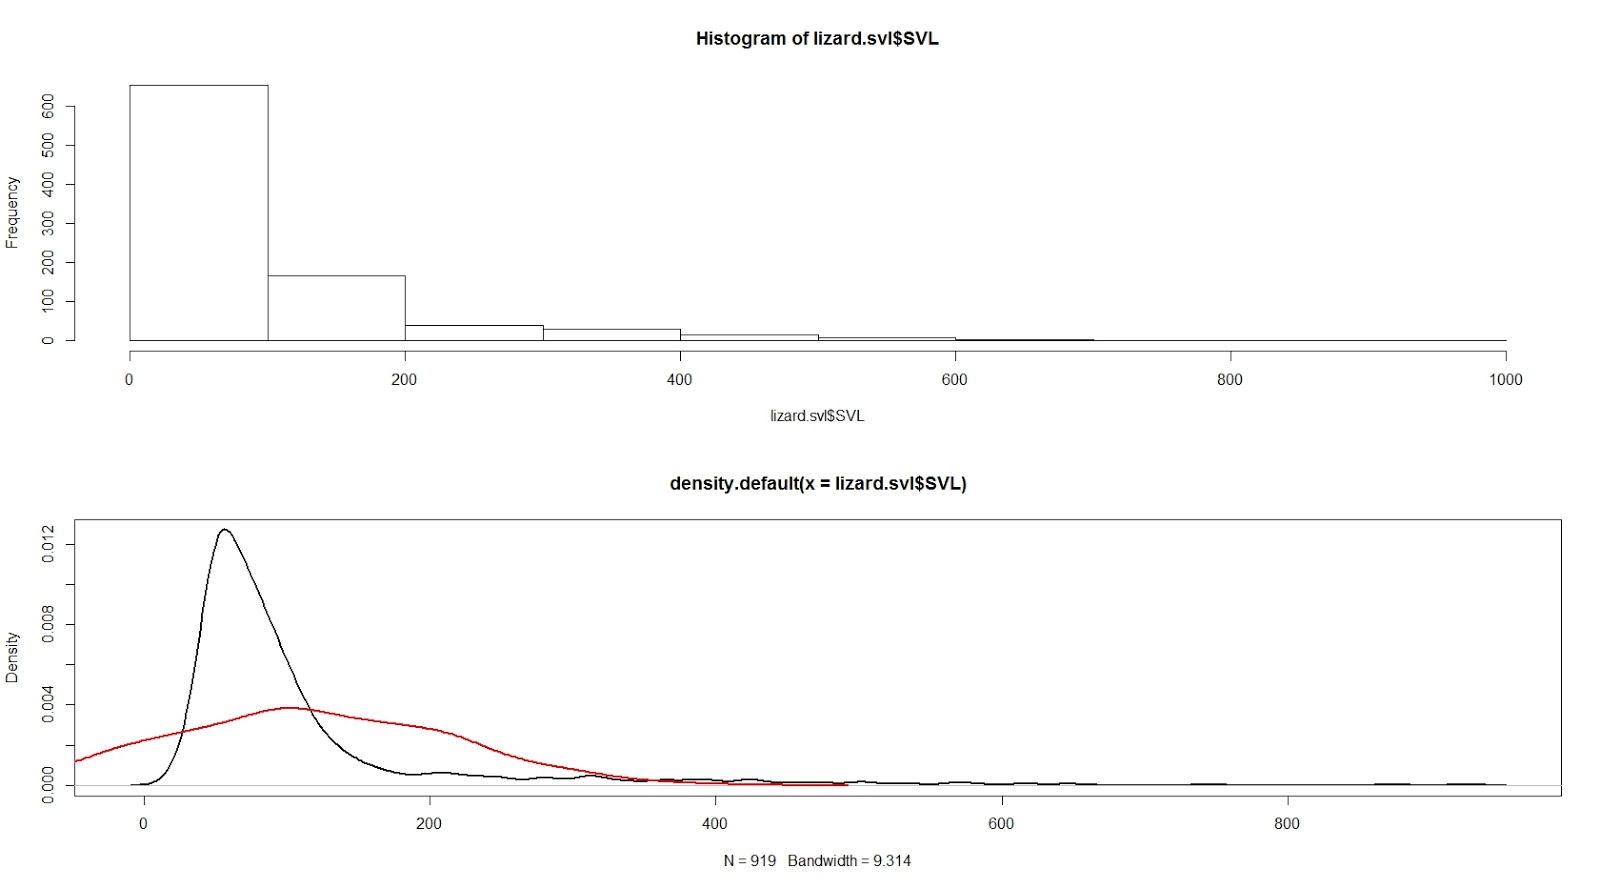 |
Exploratory analysis of the data for the body length of lizards of the
world (snout-vent length; SVL). Body lengths frequently
follow a Normal distribution, and here I am checking this assumption. The
histogram in the top panel suggests that the data is not normally distributed, which was confirmed by plotting the
densities of the distribution of measured
lengths (black line) and the expected distribution if the measures follow a
Normal distribution (red). Data freely available from here,
original journal publication here, and the code for producing the graph is available here.
|
| Exploratory analysis for the transformed lizard SVL data. In this case, I have log-transformed the body length measures to check whether this makes the data more normal. The histogram and the plot of the observed and expected distributions of measures suggest that the log transformation has resulted in a more normal distribution of the SVL data. |
No comments:
Post a Comment